

Weekly Technical Review & Market Outlook - JulyMARKET INSIGHTS REPORT
GS Gold Weekly Review (27 - 31 July 2026)
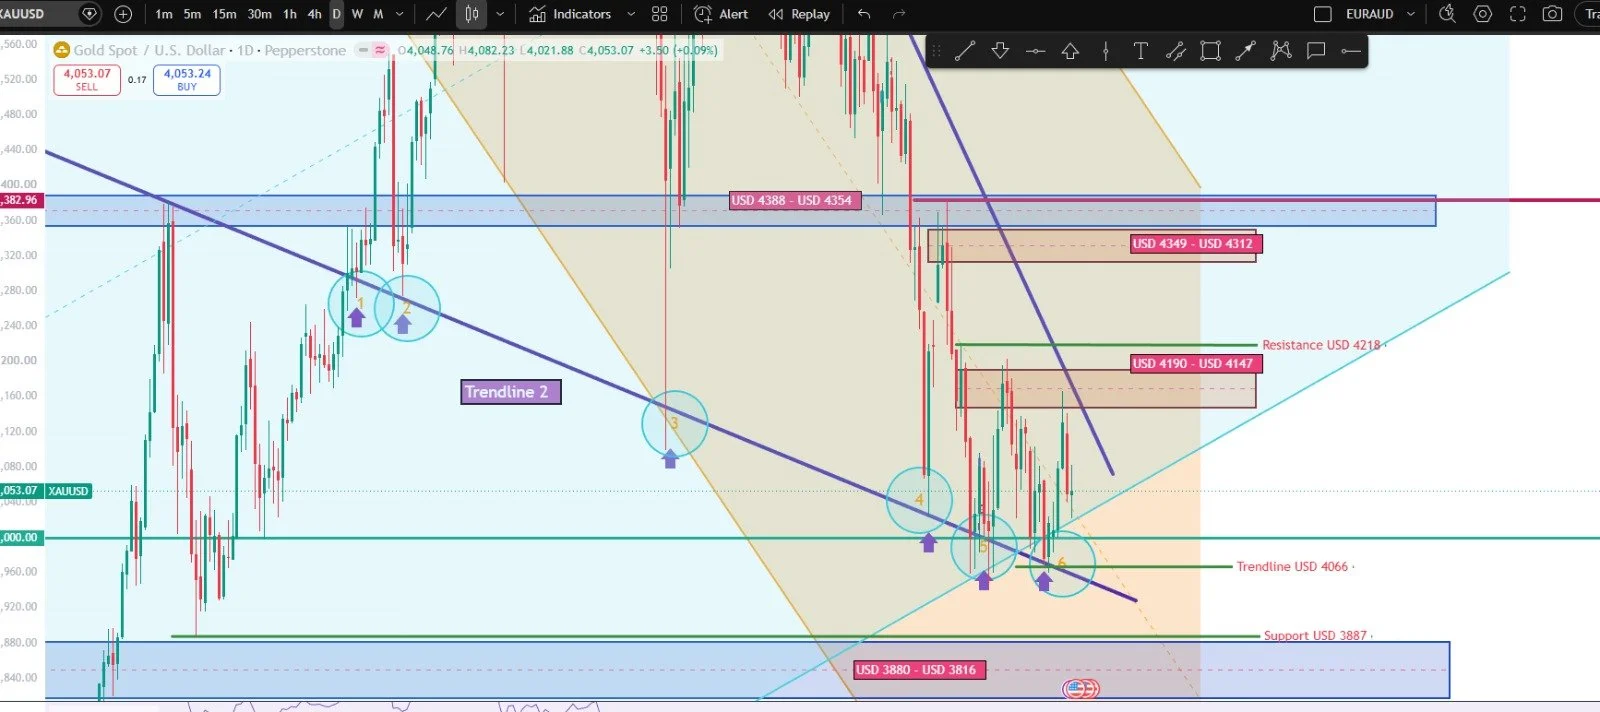
Over the past two weeks, the lower purple trendline has been tested twice, with price coming very close to the trendline on two additional occasions. This indicates that sellers have consistently attempted to push gold lower, while buyers continue to defend the psychological support level of USD 4,000 per troy ounce.
Notably, no daily candlestick has managed to reach the upper purple trendline, highlighting that bullish momentum remains weak.
Buyer vs. Seller Battle
Since 24 June 2026, sellers have attempted 11 times to push gold below USD 4,000 per troy ounce. However, buyers have repeatedly defended this key support level, preventing a sustained bearish breakdown.
This ongoing battle between buyers and sellers suggests that USD 4,000 remains a critical psychological support level for the market.
Bearish Structure Remains Intact
The overall bearish market structure remains unchanged.
Last Wednesday, gold attempted to break above the Supply Zone (USD 4,147–USD 4,190) but failed to achieve a confirmed breakout. Price was also unable to retest the upper purple trendline, indicating that sellers remain in control of the market.
Current Technical Position
Gold is currently trading:
Near the lower boundary of the long-term bullish channel (turquoise trendline).
Around the middle section of the bullish flag (light brown).
This suggests that while long-term support is still holding, the short-term momentum remains weak.
Technical Indicators
RSI is currently trading between 41 and 45, indicating that selling pressure remains dominant, although the market has not yet entered oversold territory.
MACD has crossed above the signal line, suggesting that bearish momentum is weakening. However, the MACD remains below the zero line, indicating that bullish momentum is still insufficient to confirm a trend reversal.
Conclusion
The current technical confluences continue to support a bearish outlook for gold. Although buyers are successfully defending the USD 4,000 psychological support level, sellers remain in control of the broader market structure.
A confirmed breakout above the USD 4,147–USD 4,190 supply zone would be the first indication that bullish momentum is strengthening. Conversely, a decisive break below USD 4,000 could open the door for further downside movement.
Disclaimer
This analysis is based solely on technical analysis and current market structure. Fundamental developments, geopolitical events, and upcoming U.S. economic data may significantly influence gold prices. Always wait for price confirmation and apply proper risk management before making any decisions.
GS Gold Insights "From Market Insights to Gold Ownership."