Weekly Technical Review & Market Outlook - AugustMARKET INSIGHTS REPORT
GS Gold Daily Technical Review (3 August - 7 August)
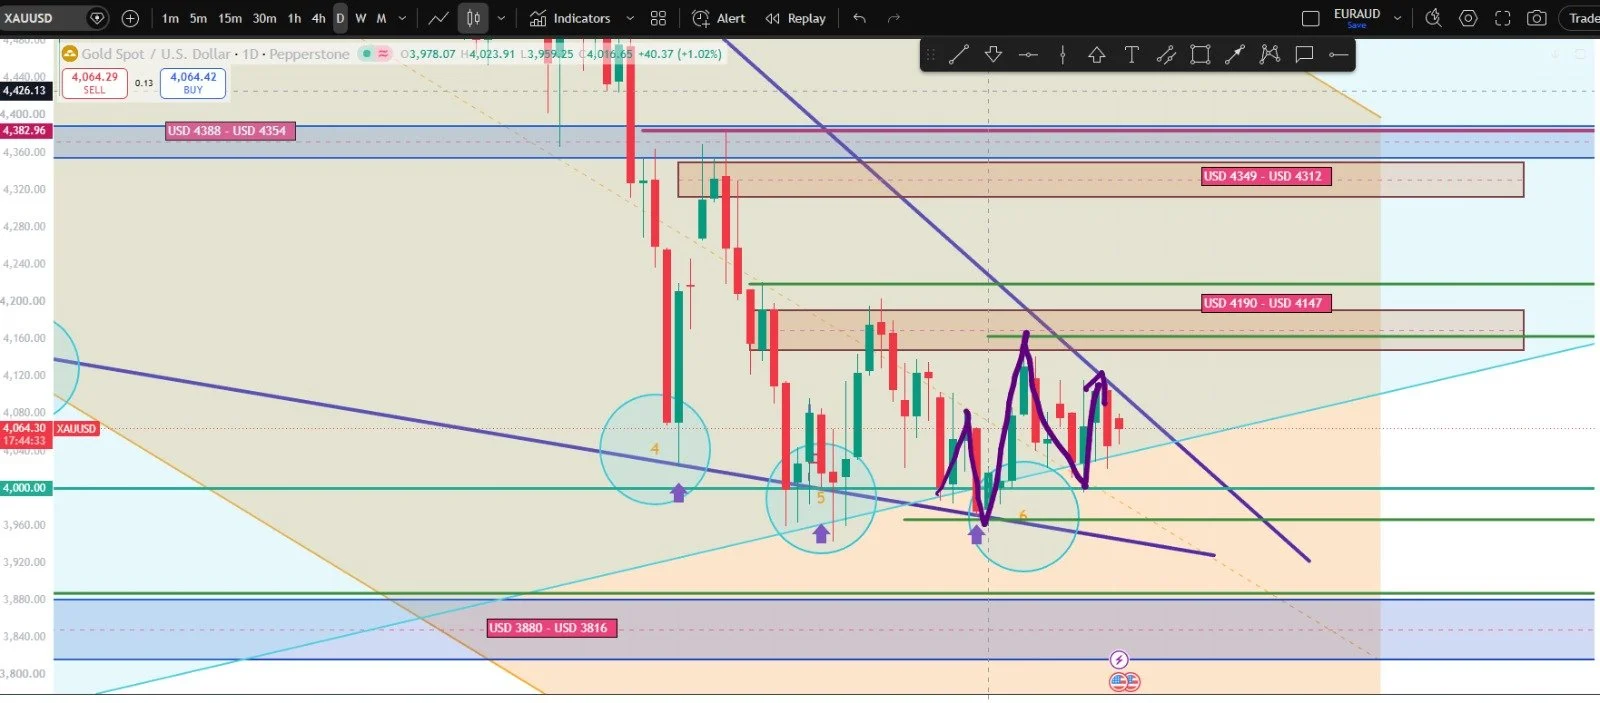
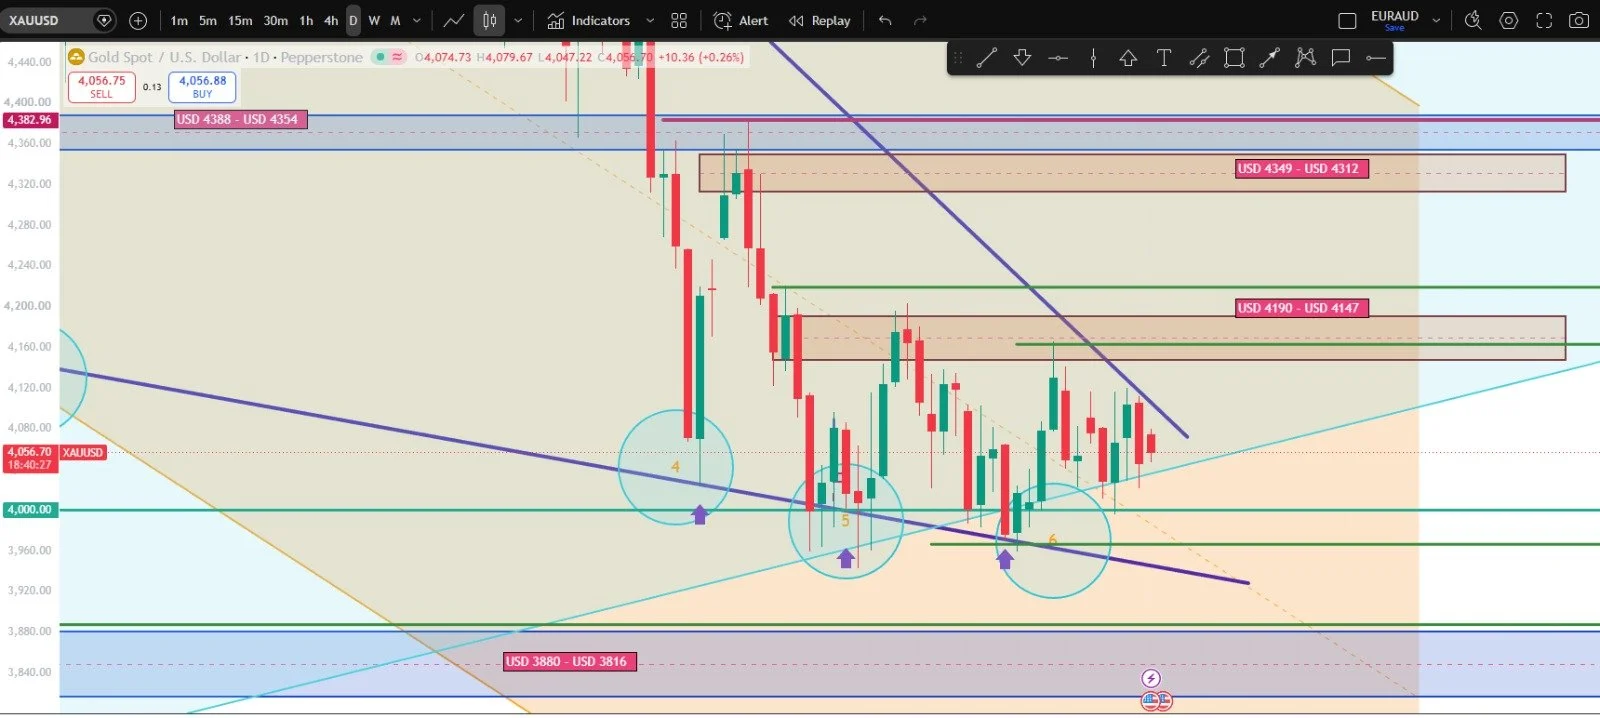
Gold failed to break above the purple descending trendline, the USD 4,162 resistance level, and the Supply Zone between USD 4,147 and USD 4,190. These levels continue to act as strong resistance, indicating that sellers remain in control of the short-term market structure.
Meanwhile, the double bottom pattern remains intact, suggesting that buying interest is still present. In addition, two consecutive bullish candlesticks have successfully engulfed the previous bearish candlestick, indicating that buyers are attempting to regain momentum.
The USD 4,000 psychological support level continues to hold firmly and remains a key area for a potential bullish rebound.
Any strong bullish rejection from the USD 4,000 support level would provide further evidence that buyers are actively defending this price zone. Conversely, a confirmed break below USD 4,000 could increase the probability of further downside movement.
Conclusion:
Although buyers continue to defend the USD 4,000 support level, gold remains below key resistance levels. The next major move will likely depend on whether buyers can break above the descending trendline and supply zone, or whether sellers manage to push the price below the psychological support at USD 4,000.
Disclaimer: This analysis is based solely on technical analysis and current market structure. Fundamental developments, geopolitical events, and U.S. economic data releases may significantly influence gold prices.
Quasimodo (QM) Pattern Analysis
The Quasimodo (QM) pattern has now been confirmed. A QM pattern is a well-known trend reversal pattern that often signals a potential shift in market direction after an established trend.
Whether the market is in an uptrend or a downtrend, price may eventually reach a key decision zone where buying and selling pressure changes, leading to a possible trend reversal.
In the current market structure, the QM pattern has formed near the lower boundary of the long-term bullish channel, suggesting that buyers are beginning to defend this area. This increases the probability of a bullish reversal, provided that price confirms the pattern by breaking above the key resistance levels.
Continue to monitor price action closely. A confirmed breakout above resistance would strengthen the bullish case, while a break below the channel support would invalidate the reversal setup and increase the likelihood of further downside.
Disclaimer: The Quasimodo pattern indicates a potential reversal, not a guaranteed one. Always wait for confirmation from price action and manage risk appropriately before entering a trade.
GS Gold Insights "From Market Insights to Gold Ownership."